One interface, seven ways to see your data
Dashboard, lists, forms, maps, Kanban, agenda, GANTT: every AYUMIA screen is built with the view that best fits your business.
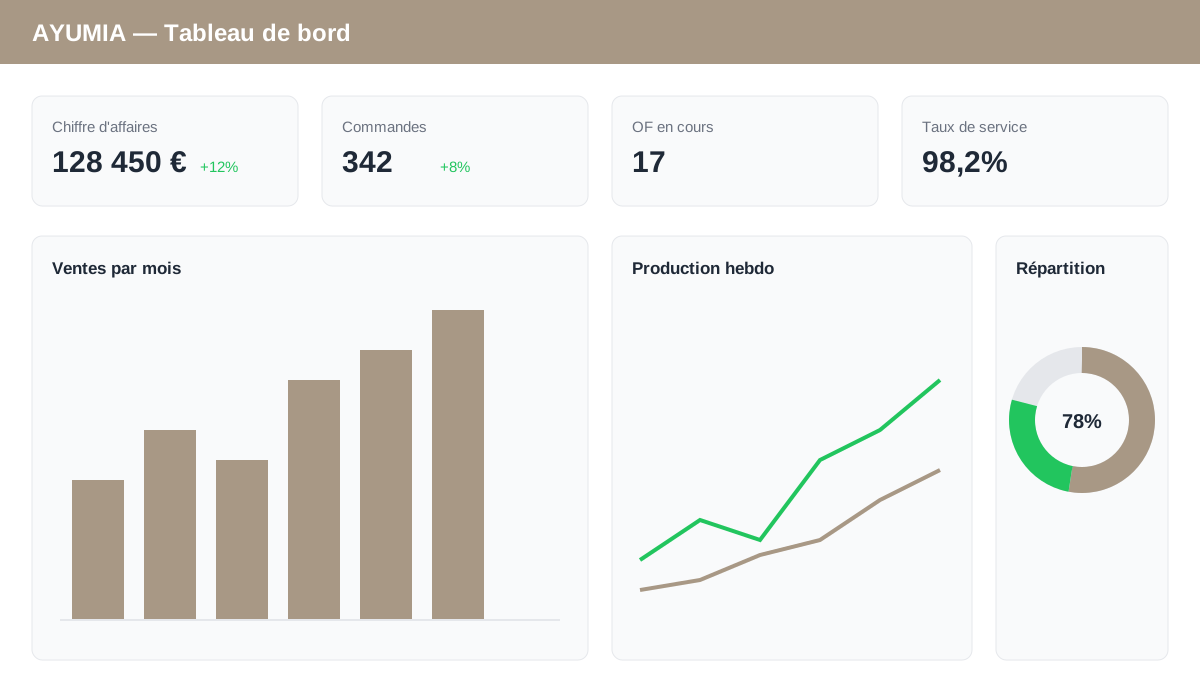
Dashboards
Real-time dashboards that recalculate your indicators on every business event.
- Customizable KPIs, charts and gauges
- More than 30 chart types
- Filters by period, site or team
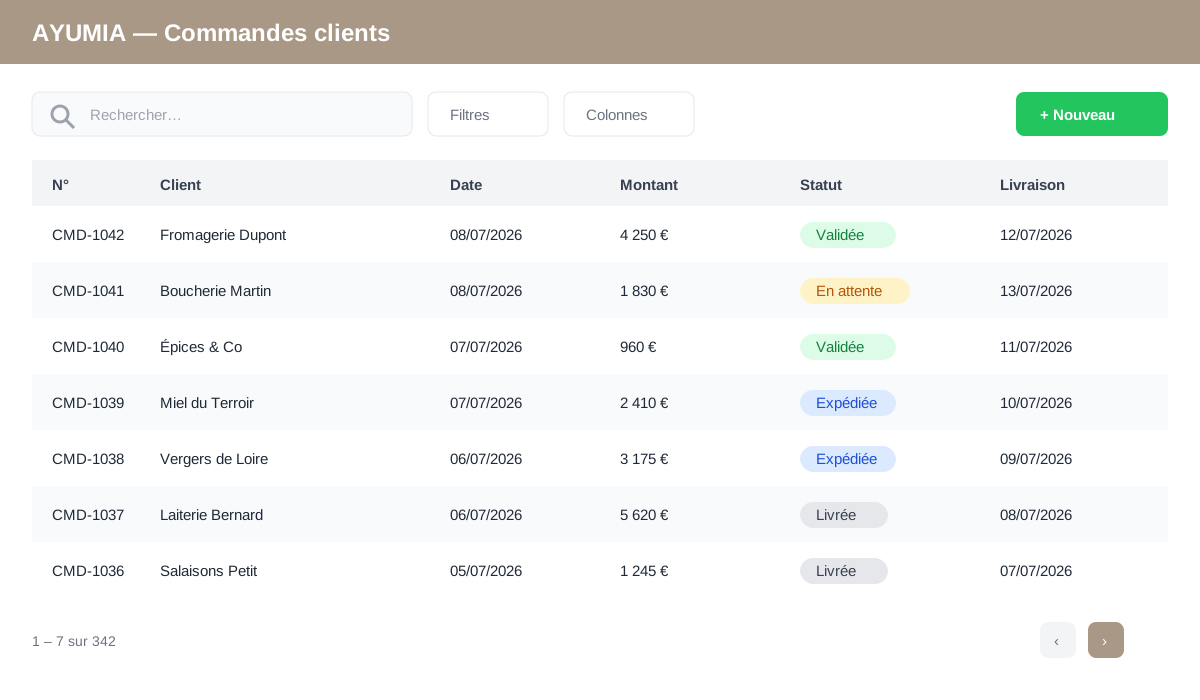
Lists
Powerful tables to manage your data day to day.
- Sorting, filters and instant search
- Columns configurable per user
- Bulk actions and exports
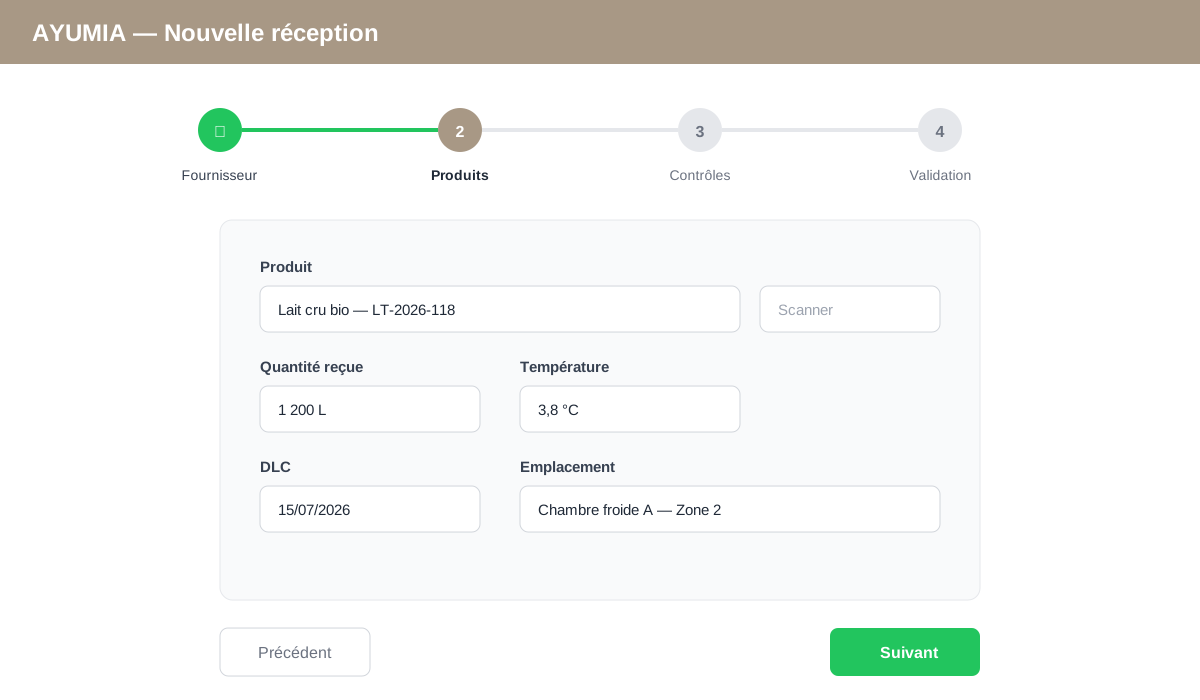
Forms & Wizards
Guided, step-by-step data entry designed for the shop floor.
- Step-by-step wizards for complex entries
- Conditional fields and automatic validations
- Barcode scanning, photos and signatures
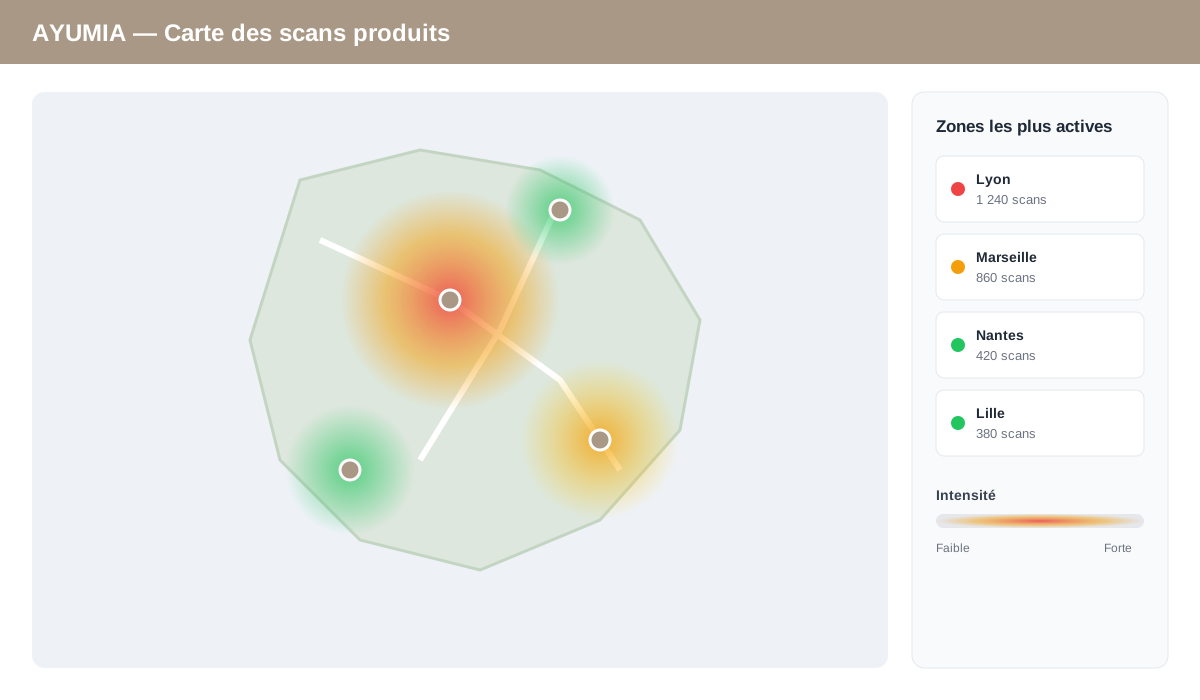
Maps & heatmaps
Visualize your geolocated data on interactive maps.
- Heatmaps of product scans
- Geolocated KPIs by region or point of sale
- Route and delivery tracking
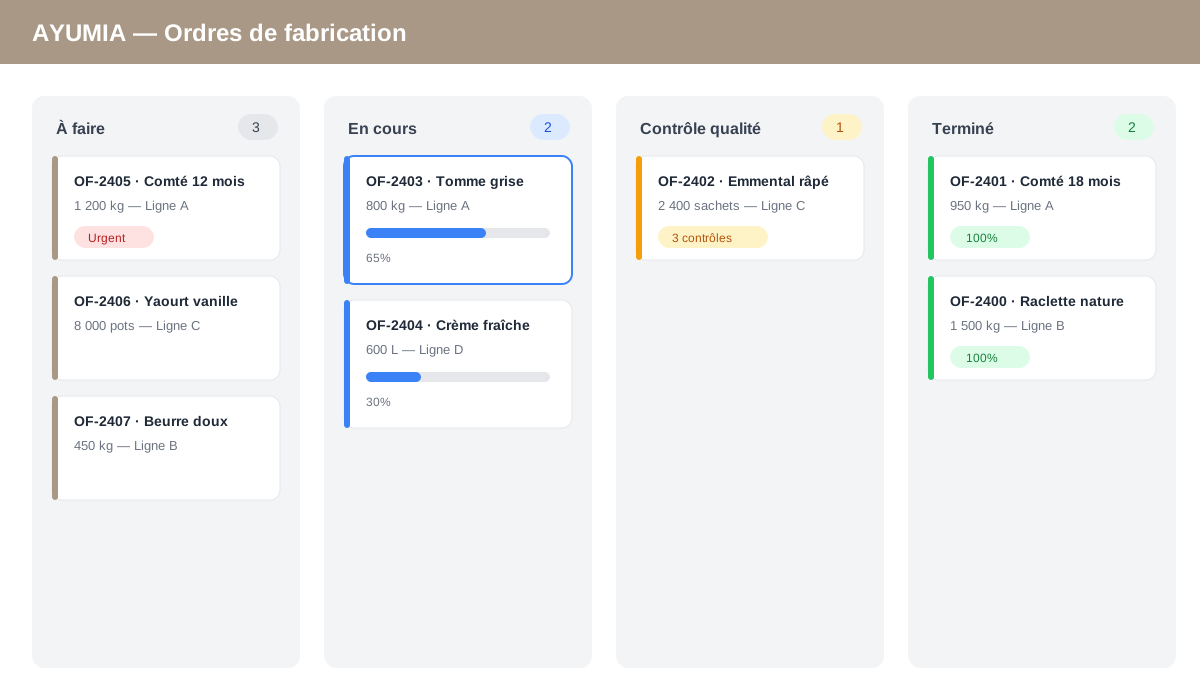
Kanban
Drive your flows with drag and drop, column by column.
- Manufacturing orders, sales orders, tasks
- Progress and priorities at a glance
- Customizable columns and statuses
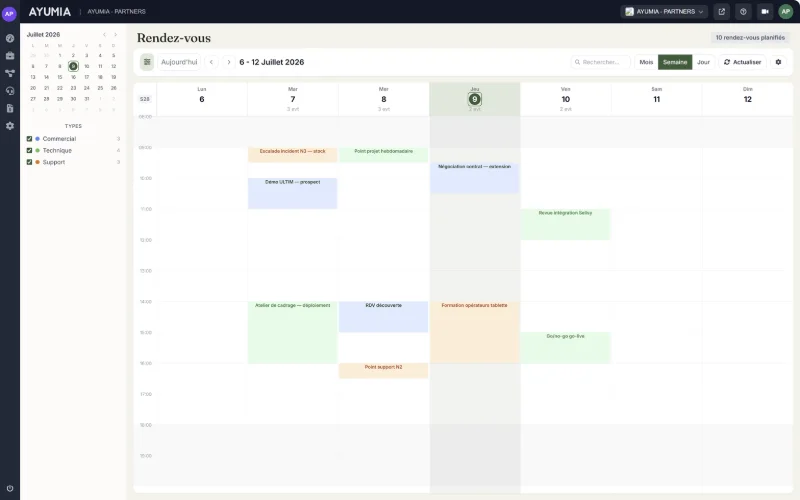
Agenda
Your teams' individual and shared calendars, in one place.
- Day, week, month views per person or team
- Sync with Google Calendar, Outlook and CalDAV
- Production, appointments, leave and maintenance
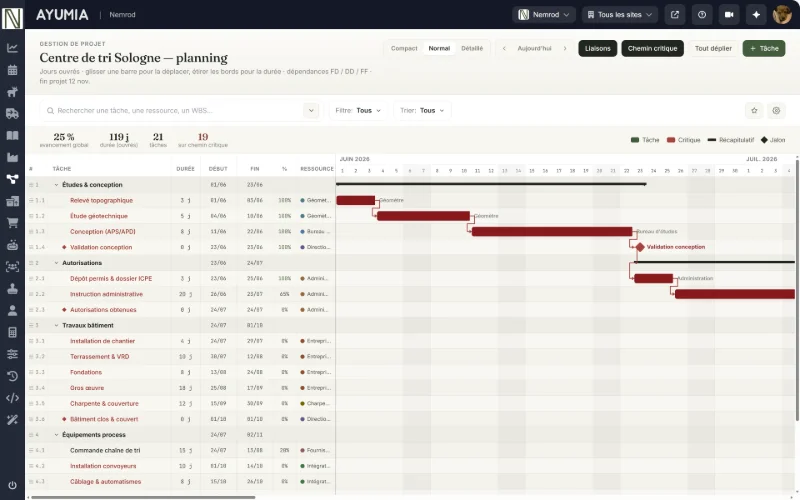
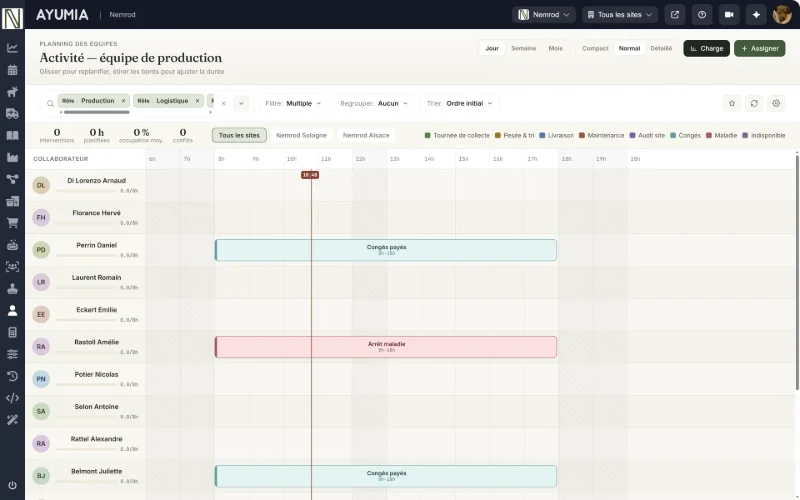
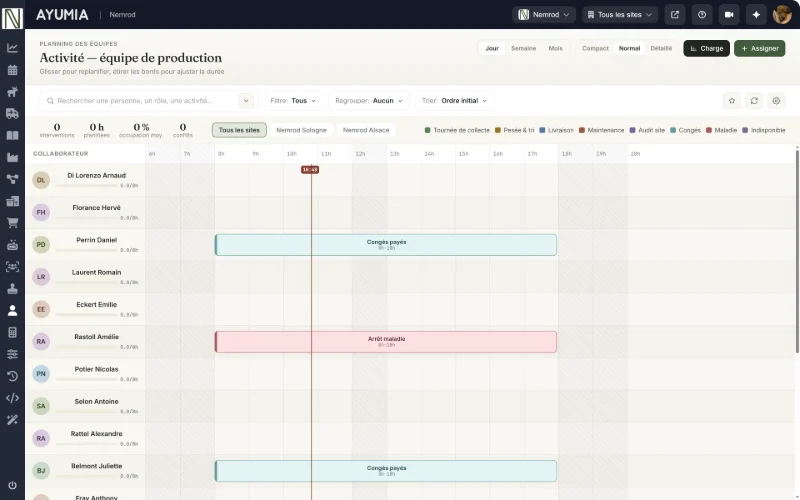
GANTT
Three complementary GANTT charts: activity, availability and project.
- Project planning with milestones and dependencies
- Team and line workload and availability
- Real-time activity tracking